
Know Exactly How Your Club Is Performing
Built-in reports give the overview on every aspect tracked through the app — members, donations, payments, meetings, events, programs, enquiries and conversions — in one analytics hub.
Why Clubs Are Upgrading to Lab of Club
See the immediate operational difference when moving from fragmented tools to a purpose-built club OS.
Running the Club on Gut Feel
- Nobody knows new vs renewing vs lapsing member counts
- Donation totals and payment conversion stay guesswork
- Meeting invites vs actual attendance never reconciled
- Event, course and enquiry performance cannot be compared
A Report for Everything the App Tracks
- Membership: new members, renewals and membership trends
- Money: donation volume, amounts and payment conversion
- Governance: meetings held, invited vs attended and attendance rate
- Growth: bookings, attendees, event revenue, enrolments, completions, enquiries, SLA, applications and conversion
Engineered for Operational Excellence
Explore the purpose-built tools designed to give your staff and committee complete control.
New Members, Renewals and Trends
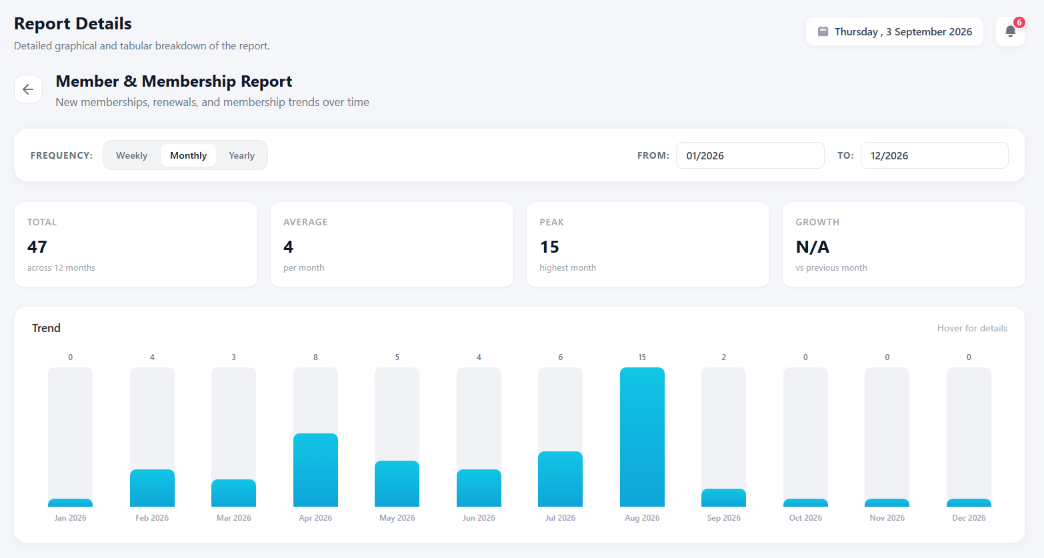
Report Details drill into the Member & Membership Report: new memberships, renewals and trends over time — Total 47 across 12 months.
- Headline cards — Total 47 across 12 months, Average 4 per month, Peak 15 highest month, Growth vs previous month
- Monthly trend bars Jan → Dec 2026 with hover-for-details per month
- Weekly / Monthly / Yearly frequency with From–To range (01/2026 → 12/2026)
- One view feeding dashboard growth and dues follow-ups
Donations, Payments and Meeting Activity
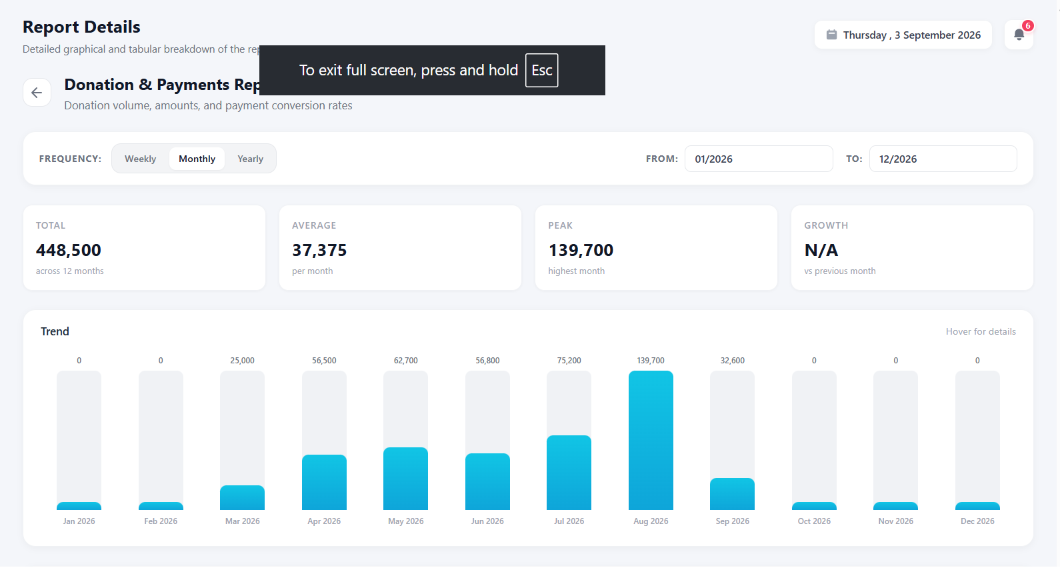
The Donation & Payments Report proves fundraising with numbers — volume, amounts and conversion — beside governance-grade meeting activity.
- Donation volume and amounts — Total 448,500 across 12 months, Average 37,375 per month, Peak 139,700
- Monthly trend bars with hover-for-details plus Weekly / Monthly / Yearly frequency and From–To range
- Meetings held with invited vs attended per meeting
- Attendance rate trends by committee and period
Bookings, Programs, Enquiries and Conversion
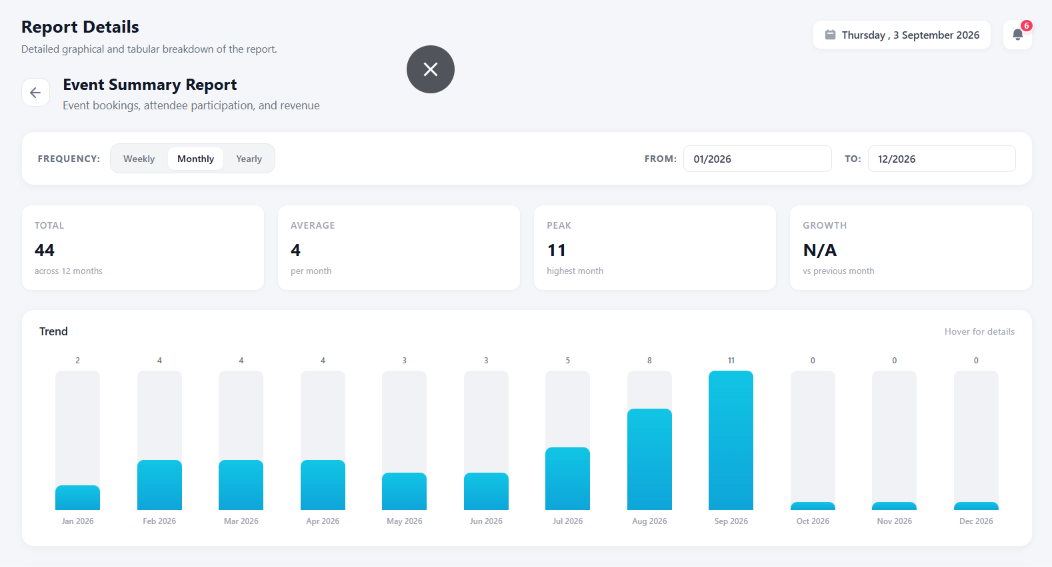
The Event Summary Report closes the loop on engagement — bookings, attendee participation and revenue — beside programs, enquiries and conversion.
- Event bookings, participation and revenue — Total 44 across 12 months, Average 4 per month, Peak 11
- Monthly trend bars Jan → Dec with hover-for-details per month
- Program enrolments, course completions and completion rates
- Enquiries with response SLA plus applications and enquiry-to-member conversion
Frictionless Workflow in 3 Simple Steps
Designed for high adoption among committee members, staff, and club members alike.
Operate in the App
Members, payments, meetings, events, programs and enquiries happen inside Lab of Club.
Open Reports
Pick the aspect — membership, money, meetings, events, learning or leads.
Act on the Trend
Follow up renewals, fix attendance, scale winning events and campaigns.
Delivering Measurable Results to Premier Clubs
Aspect Coverage
A report for each aspect of the club tracked through the app.
Tracked-Through Data
Reports reflect real in-app activity, not manual sheets.
Response Visibility
Enquiry response times and conversion stay accountable.
Rates That Matter
Attendance, completion, payment and conversion rates ready.
Got Questions? We’ve Got Answers.
Everything you need to know about implementing this module for your organization.
Ready to Elevate Your Club’s Reports?
Get a personalized 1-on-1 walkthrough configured to your club’s exact membership tiers, bylaws, and committee workflow.